Warning: this post is NOT theological in nature
(also this post is unusually long and contains no pictures)
Today, I am finally (almost) recovered from a week-long combination of illnesses I picked up in Turkey. It seems that I got some sort of viral gastroenteritis and, through vomiting, gave myself a minor neck injury that resulted in a burning-cluster-like week-long headache. In Turkey, I saw a doctor at an urgent care who gave me medicine to stop the diarrhea and vomiting long enough to get me back to Slovakia – and the combination of visit and medicine cost me $12. In Slovakia, I went to the hospital and was sent to their geographical and infectious disease ER. I was seen in 2 hours, and had blood test results after 2 more. I was seen by one of the best infectious disease doctors in Slovakia (who spoke English so I didn’t even need an interpreter). I left with a prescription, feeling much better. The entire hospital visit, including all the tests, cost me $80 (and this is without insurance!).
I had been afraid to go to the doctor, both in Turkey and in Slovakia, because I had been worried about how much it would cost. My American insurance should cover me abroad, but that would be on a reimbursement system and I do not have the money to pay out-of-pocket what a hospital visit in the US would cost. Slovakia, Turkey, China – and all the other places I have had to go to the doctor – do not recognize my American insurance. But I was really sick, and it was vital that we make sure that nothing serious was wrong with me.
All this was happening in the wake of the announcement of the Supreme Court striking down Biden’s student loan forgiveness program. Now, you might be wondering what my hospital visit in Slovakia has to do with my student loans? The connection is twofold:
- My 80-dollar insurance-less hospital visit made me think a lot about debt in the US, particularly medical debt and how broken the US healthcare system is.
- I got to spend a lot of time lying around, unable to think clearly, focus long enough to read a book, and in too much pain to watch anything. I was basically reduced doom-scrolling Facebook for a few minutes at a time, and I saw many posts along the lines of “stop whining – you took out a loan, you repay it”, re: Biden’s student loan forgiveness plan.
On the one hand, those blithe comments seem fair. If you take out a loan, you repay it. What’s so complicated about that? But on the other hand, those comments would not actually be equitable if the people making those comments had to pay less for a comparable service. What I mean is this:
Let’s say we live in the world where all the jobs that would allow you to live above the poverty line require you have a car.[1] Let’s say this was true in 1970, and it was at least equally true today, in 2023. But let’s also say conditions in 1970 meant that you paid only 100 dollars for a car, and that in 2023 a car was 500% more expensive. People would still need cars, so they would still buy cars, but the burden would be a lot higher – and if returns did not match that increased burden, perhaps it would be a jerk-move for someone who got a car in 1970 to ridicule someone now.
If we are to look just at the simple tuition costs, it seems like this analogy is born out. The cost of in-state tuition, for example, at University of Hawaiʻi is currently $12,186.[2] In 2023 dollars, the cost of tuition in 1970 was $1,800 ($233 in 1970 dollars).[3] This would be an increase of 577% for tuition alone.
But does this analogy really bear out? Is it only higher education that is proportionately more expensive? I wanted to know.
Where possible, I localized my research to Hawaiʻi, though in some cases national data was what was accessible to me. I first investigated measures of income in Hawaiʻi, and compared data between 1970 and 2023, including Per Capita Income, median household income, and GINI index, and wages for college graduates. Then I investigated measures where it is possible to see how costs have changed: CPI, costs of electricity, and rent & housing. Finally, I turned to national data on healthcare premiums and health care spending. All dollar amounts are shown in 2023 dollars, unless otherwise indicated.[4] I have tried my best to make as fair a comparison as possible and avoided situations in which two statistics are not actually comparable.
I have heard so many people, ignited by this student loan conversation, argue either that students do, or do not, deserve loan forgiveness. My investigation, which does not control for contributing factors such as race, immigration status, etc, was to settle for myself the question of to what extent the situation of those who came of age in the 70’s faced a comparable situation to students in 2023.
My answer is no, based on the following research.
Income:
The first realm to consider is income. To what extent does income in the 1970’s compare to income today? Two measures of this are per capita income and median household income. Per Capita Income as a measure averages all people in Hawaiʻi, including those who do not or cannot work – this is the statistic I was able to find for both 1970 and today.
Per capita income in Hawaiʻi has increased by 55%. Go Hawaiʻi! However, the story is a little less straightforward when we look at median household income.
This would indicate a 12% decrease in medium household income, but there is a caveat. These numbers are not exactly fair. The 2023 number covers all families while the statistic I was able to find specifies a family of 4. This excludes many families, and disproportionally excludes poorer families who often have more children.[9] As such, this needs to be taken with a grain of salt. There is another really important consideration in considering median household income, namely that increases in wages have not been distributed equally across all socio-economic classes.
What’s obscured?
During the measurement period of 2017-2021, Hawaiʻi’s GINI index was 0.44, which is on par with the US value of 0.48.[10] In Hawaiʻi, in 1970, the GINI index was only 0.38.[11] The percent change is 16%. What does this look like? It means that since the late 1970’s, household income among the poorest 20% of the population has only increased 13%, while in the middle 20% it has only increased 30% and for the richest 20% it has increased 61%.[12] The growth, which we can see reflected in household income #s and per capita increases, has not been equal across economic groups.
In short, people in Hawaiʻi are making more than they did in 1970. However, these increases have been minimal for the poorest segments of Hawaiʻi’s population (who are disproportionately native Hawaiians).[13] These increases have been modest for the middle class, and the most profound for those who were already wealthy.
But what about wages for college graduates, which in part inspired this post?
Wages for College Graduates:
It was easier to find national data for this one. In the US, the reported starting salaries for those with a bachelors degree in 1970 vs now are:
These are huge increases. If you were like me, on the lowest-earning part of the scale as a humanities major, the percent increase is still 300%. In 2023, the median yearly income for a 25–34-year-old worker with a bachelor’s degree is $59,600, compared to those with only a high school diploma (36,600).[16] However, both groups of workers are seeing wage-growth after serious wage stagnation before the pandemic.[17]
In short, college education is still key to economic stability, maybe even more so than it was in the 1970’s.
A Caveat
If this national data on college graduates and their wages holds true from Hawaiʻi (and modern statistics from the University of Hawaiʻi seem to indicate that it does), then why is Hawaiʻi’s per capita income only 55% higher than it was in the 1970’s?[18] These increases in wages have disproportionately affected those with access to resources already.[19]
Wages: A Summary
In short, wages have risen since 1970 in Hawaiʻi. This rise in wages has disproportionately affected the wealthiest strata of society in Hawaiʻi. Education has been, nationally, an important factor for earning more. However, increased income is only one part of the story. To what extent have costs changed since 1970?
Costs
Many people feel like things cost more. But do they? I considered several data points. First, the CPI, which is an important marker for inflation.
Consumer Price Index
This data is a little tricky, but the Bureau of Labor statistics has a cost of living index that compares prices to a base period of 1982-1984.[20] This is the CPI or “consumer price index” which is “a measure of the average change overtime in the prices paid by urban consumers for a market basket of consumer goods and services”.[21] This CPI is directly related to inflation.[22]
So the following compares 2023 and 1970 both to the base period of 1982-1984, which represents 100.[23] “Urban Hawaiʻi” is the categorization they have, presumably for Honolulu (though maybe it includes the neighbor island cities? I’m not sure). The graph, from the Department of Labor, looks like this:
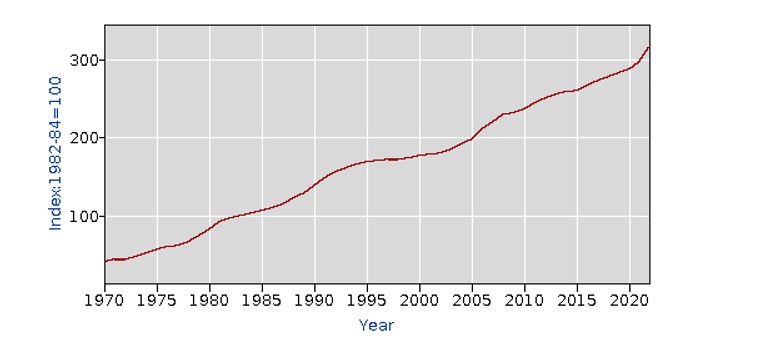
Our markers are:
- 2023 (annual #): 322.7
- 1970 (annual #): 41.5
What do these number mean? Well, these numbers are markers of percentage change. So a score of 110, for example, would indicate a 10% increase while a score of 90 would indicate a 10% decrease in costs since 1982-1984.
So in 2023, prices were a whopping 222.7% higher than in 1982-1984. In 1970, prices were 58.5% lower than in 1982-1984. Now I don’t think it would be mathematically kosher to do a simple % change calculation, it is clear that from 1970 to 2023 it has gotten a lot more expensive to purchase goods and services. Our buying power has decreased significantly, and much more drastically than our increases in income have been able to cover. There are a few areas in which this is glaringly true. We have already looked at tuition at the University of Hawaiʻi, but now I would like to look at housing and healthcare.
Housing:
How much does it cost to lodge in Hawaiʻi, now vs in 1970? How does the price of utilities compare?
Purchasing a Condominium in Honolulu (median sale price):
This is an 87% increase.
Monthly Rent for a 2 bedroom, nonluxury apartment in Honolulu:
This is a 32% increase in each month’s rent.
Other interesting information: the median sale price for a single-family home has increased 597%, and for a condo 468% since 1985 across Oʻahu.[28] The median sale price for a condo in 1985 (in 2023 dollars) would be $449,724 (or $158,600 in 1985 dollars). The cost is now $1,105,000. So even if we consider inflation, that sharp increase in cost of housing is HUGE. This is a 146% increase in the cost of a single-family home across Oʻahu since 1985.
Electricity: Average cost per Kilowatt-Hour in Urban Hawaiʻi:
- 2023 (January): $0.45
- 1978: $0.23 ($0.05)[29]
This is a 96% increase in the price per kilowatt hour. Now if the average household in Hawaiʻi uses 537 kWh per month, what would that mean?[30]
Monthly Electric Bill
- 2023: 241.65
- 1978: 123.41
Or a 49% increase.
What does all this mean? While wages in Hawaiʻi, overall, have risen, other costs have risen as well. For anyone who is not in the upper 20%, these rises in cost are hitting hard. Wages have not increased nearly enough to match the rise in prices in Hawaiʻi. This is part of a national trend in problems of wealth creation and socioeconomic status among young adults.[31] Young adults are entering the workforce at a time where it cost
- disproportionality more to get education needed for good-paying jobs
- those good-paying jobs have not increased their wages porptionately to the cost of living
- the cost of living is significantly more than it was in the 1970’s
Medical Care:
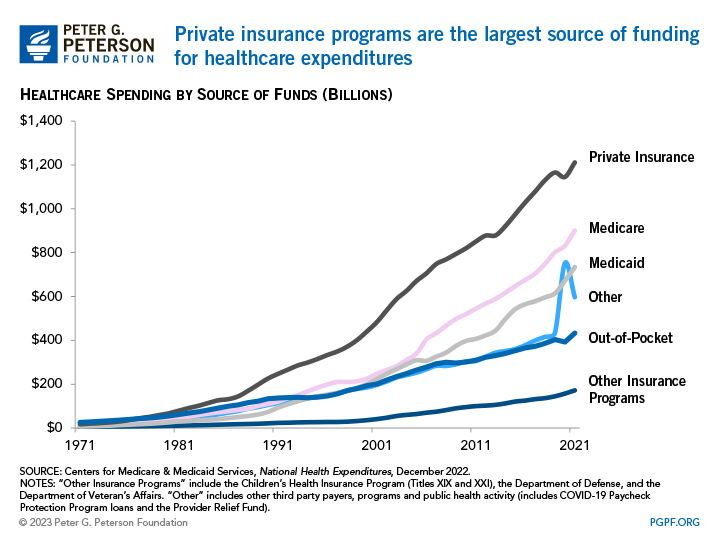
Healthcare spending in the US is at an all-time high.[32]
Health Insurance:
In part, this is because health insurance is extremely expensive. Average monthly cost for a PPO plan for a 30-year old adult is $458.[33] In 1977, for the average adult, that was only $463.20 ($92 in 1970) – per YEAR.[34] This is a 1086.53% increase for a single adult. Medical care also costs more.
National Expenditure on Health Care:
2021: 4.3 trillion dollars for a population of 331.9 million or about $12956 per person. In 2021,
1970: 372.6 billion (74.1 billion in 1970) for a population of 204 million people.[35] That brought the per-capita spending, a combination of out-of-pocket and paid-by-insurance costs to approximately $1826.[36]
This is a 604% increase per capita.
Life is more expensive, and wages have not increased to keep up with these increases. By some measures, Hawaiʻi is doing comparably to the 1970’s – for example, percentage of the population of Hawaiʻi below the FEDERAL poverty line in 1970 was 9.3%[37], and in 2021 was 9.5%.[38] However, the federal poverty line, as that article from the 70’s points out, is a terrible gauge for Hawaiʻi.
In short: Have Increased Wages Kept up with Increased Costs?
In a 2022 article for Hawaiʻi Business Magazine, Noelle Fujii-Oride tracked Hawaiʻi’s paychecks vs cost of living since 1969.[39] Her findings were disheartening: “inflation swallowed up almost all of the wage gains over the past five decades,” she writes, finding that “Hawai‘i’s average annual wages, adjusted for inflation, have only increased 16% since 1969.” She also found that wage growth lagged significantly behind productivity increases: “productivity in Hawai‘i grew an average 0.76% each year from 1969 to 2020 while wages grew by an average 0.29%.” There have been some real wage increases in Hawaiʻi, especially if the national data for college graduates is applicable. But the increases in prices for goods, housing, and medical care since 1970, combined with inflation, makes the situation bleak even for that lucky segment of the population.
Results:
I began this analysis because I wanted to find out for myself and to the best of my ability to what extent the economic situation in the 1970s in Hawaiʻi is comparable to today’s situation. I am sure there are many important factors that I missed, but I found that:
- Even with in-state tuition at University of Hawaiʻi, the increase in tuition costs is not proportionate to an increase in wages
- College graduates across the nation still earn significantly more than their peers without degrees, and in fact do make more than their counterparts without degrees (even controlling for race and gender)
- Things cost way more than they did in 1970, at least where housing, electricity, education, and healthcare are concerned
- Increases in wages have not matched these increases in costs
In short, while it might seem fair to criticize people for wanting debt forgiveness, it is not equitable for people who paid significantly less to get a similar opportunity to level those criticisms. Things do cost more now, and education is more important than ever as a gateway to a living wage. The situation is not comparable to 1970, at least.
[1] Education attainment is a huge factor in lifetime earnings. See: https://www.ssa.gov/policy/docs/research-summaries/education-earnings.html
[2] https://www.sofi.com/university-of-hawaii-at-manoa-tuition-and-fees/?__cf_chl_tk=Hw5w_eryYZZXr1EXS0vN5TOnSPBfqJ5g.O.t0JkEX2w-1689667119-0-gaNycGzNC-U
[3] Source for tuition: chrome-extension://efaidnbmnnnibpcajpcglclefindmkaj/https://www.demos.org/sites/default/files/publications/DEMOS_DFC_Yearbook_FA_Optimized_0.pdf page 8.
[4] Inflation calculation: https://www.in2013dollars.com/us/inflation/1970?amount=233
[5] https://tradingeconomics.com/united-states/per-capita-personal-income-in-hawaii-$-a-na-fed-data.html
[6] https://united-states.reaproject.org/analysis/comparative-trends-analysis/per_capita_personal_income/tools/150000/0/
[7] https://tradingeconomics.com/united-states/median-household-income-in-hawaii-fed-data.html
[8] 1974 is chosen because that is the available data. My source for the income number is page 428 of this report: chrome-extension://efaidnbmnnnibpcajpcglclefindmkaj/https://files.hawaii.gov/dbedt/economic/databook/db2000/sec13.pdf
[9] : https://ifstudies.org/blog/how-income-affects-fertility
[10] https://www.hawaiihealthmatters.org/indicators/index/view?indicatorId=288&localeId=14 . How was this calculated? chrome-extension://efaidnbmnnnibpcajpcglclefindmkaj/https://files.hawaii.gov/dbedt/economic/data_reports/e-reports/Income_Distribution_in_Hawaii.pdf
[11]Slottje, Daniel, “Change in the U.S. Income Distribution from 1970 to 1980: Assessing State and Regional Impacts”, The Journal of Human Resources 25, 2 (1990): 272 https://www.jstor.org/stable/145757
[12] chrome-extension://efaidnbmnnnibpcajpcglclefindmkaj/https://www.cbpp.org/sites/default/files/atoms/files/Hawaii.pdf
[13] https://www.hawaiinewsnow.com/2022/12/07/report-finds-sharp-spike-percentage-hawaii-residents-living-poverty/
[14] https://www.naceweb.org/job-market/compensation/salary-trends-through-salary-survey-a-historical-perspective-on-starting-salaries-for-new-college-graduates/
[15] https://www.forbes.com/advisor/student-loans/average-salary-college-graduates/
[16] https://www.forbes.com/advisor/student-loans/average-salary-college-graduates/
[17] https://www.epi.org/blog/class-of-2023-young-workers-have-experienced-strong-wage-growth-since-2020/, compare: https://www.epi.org/publication/charting-wage-stagnation/
[18] https://www.payscale.com/college-salary-report/best-schools-by-state/bachelors/hawaii
[19] https://www.hawaiibusiness.com/tracking-hawaii-paychecks-minimum-wage-living-costs-inflation/
[20] This is an incomplete cost-of-living index because it does not consider standard of living. See #9 on https://www.bls.gov/cpi/questions-and-answers.htm#:~:text=The%20Consumer%20Price%20Index%20(CPI,of%20consumer%20goods%20and%20services.
[21] https://www.bls.gov/cpi/questions-and-answers.htm#:~:text=The%20Consumer%20Price%20Index%20(CPI,of%20consumer%20goods%20and%20services.
[22] https://www.forbes.com/advisor/investing/cpi-consumer-price-index/#:~:text=CPI%20illustrates%20how%20much%20each,the%20same%20amount%20of%20money.
[23] https://data.bls.gov/pdq/SurveyOutputServlet is the tool I used
[24] https://www.staradvertiser.com/2023/04/07/hawaii-news/oahu-condo-prices-hit-record-homes-top-1-million/ also see: https://www.hawaiipublicradio.org/local-news/2022-02-08/median-price-for-oahu-condos-sets-new-record-in-january
[25] Page 6 chrome-extension://efaidnbmnnnibpcajpcglclefindmkaj/https://www.huduser.gov/portal/publications/pdf/scanned/scan-chma-HonoluluHawaii-1971.pdf
[26] https://www.renthop.com/average-rent-in/urban-honolulu-hi
[27] Page 7 chrome-extension://efaidnbmnnnibpcajpcglclefindmkaj/https://www.huduser.gov/portal/publications/pdf/scanned/scan-chma-HonoluluHawaii-1971.pdf
[28] https://www.hicentral.com/oahu-historical-data.php
[29] 1978 was the first available data I could find. https://fred.stlouisfed.org/series/APUS49F72610
[30] https://shrinkthatfootprint.com/average-household-electricity-consumption/
[31] https://edition.cnn.com/2020/01/11/politics/millennials-income-stalled-upward-mobility-us/index.html
[32] https://www.pgpf.org/blog/2023/04/healthcare-spending-in-the-united-states-remains-high
[33] https://www.forbes.com/advisor/health-insurance/how-much-does-health-insurance-cost/
[34] Table 1 https://www.ncbi.nlm.nih.gov/pmc/articles/PMC4192957/
[35] https://www.cms.gov/Research-Statistics-Data-and-Systems/Statistics-Trends-and-Reports/NationalHealthExpendData/NationalHealthAccountsHistorical is the data source, but also reported https://www.healthsystemtracker.org/chart-collection/u-s-spending-healthcare-changed-time/
[36] https://www.cms.gov/research-statistics-data-and-systems/statistics-trends-and-reports/nationalhealthexpenddata/nhe-fact-sheet
[37] chrome-extension://efaidnbmnnnibpcajpcglclefindmkaj/http://www2.hawaii.edu/~kent/ThousandsHiMalnourished.pdf
[38] https://www.hawaiihealthmatters.org/indicators/index/view?indicatorId=347&localeId=14
[39] https://www.hawaiibusiness.com/tracking-hawaii-paychecks-minimum-wage-living-costs-inflation/
Leave a Reply